Analysis of water pollution research based on UAV hyperspectral
Introduction:
Water is the source of life, as well as the blood of the ecosystem, is the basis of human survival, production and life. Sufficient quality water resources are the first condition for the healthy cycle of the ecosystem, but water resources are very vulnerable to pollution, especially some inland water bodies, due to the natural closed its pollution problems are more prominent. While the water resources as a carrier of pollutants, with dynamic diffusion and spread characteristics, will further aggravate the degree of pollution of water bodies. There are many rivers and lakes in China, along with the rapid development of the economy and the enhancement of human activities, the problem of water quality pollution in rivers and lakes has become increasingly serious, has become a key factor limiting the sustainable development of cities, so it is necessary to use high-tech means to carry out research on water quality pollution in rivers and lakes, to provide timely and rapid water quality conditions in rivers and lakes, to protect people's normal production and life.
Traditional river and lake water quality monitoring is mainly used in the field sampling and laboratory analysis, this monitoring method needs to be fixed in rivers and lakes, fixed profile, through years and years of monitoring, recording and laboratory analysis, although it can achieve a certain degree of data accuracy, but cannot reflect the overall spatial and temporal conditions of river and lake water quality, and time-consuming, limited monitoring area, only has a local and typical. It cannot meet the requirements of real-time, rapid and large-scale monitoring and evaluation.
The development and progress of remote sensing technology have opened up new ways for the monitoring and research of river and lake water bodies. Remote sensing water quality monitoring technology with high dynamic, low cost and macroscopic and other significant features, in the river, lake water quality pollution research has the advantages of conventional detection cannot be replaced. It can meet the needs of large-scale water quality monitoring, but also reflect the distribution and changes in water quality in space and time, to make up for the shortcomings of a single use of water sampling, but also to find some conventional methods difficult to reveal the distribution of pollution sources and the migration characteristics of pollutants and the scope of impact, to provide the basis for the scientific deployment of water sampling points. Hyperspectral remote sensing is widely used in remote sensing water quality monitoring due to its high accuracy, multi-band, enormous amount of information and other characteristics, which greatly improves the accuracy of water quality parameters estimation. Along with the continuous progress of remote sensing technology, water quality monitoring has shifted from qualitative description to quantitative analysis, while the water quality parameters that can be monitored gradually increased, and the accuracy of inversion has been improved, playing a major role in the protection, planning and sustainable development of water resources. With the increasing maturity of UAV technology, the latest remote sensing technology based on UAV platform has emerged and gained the favor of remote sensing staff, and scientific researchers are expecting its application prospects in the industry.
At present, the UAV with imaging spectrometer can be used to monitor the concentration of suspended solids, turbidity, transparency, total phosphorus concentration, total nitrogen concentration, water depth, chemical oxygen demand (COD) of rivers and lakes.
1.Material and experimental part
1.1 Study area
The field test flight area is the Daqing River. The following figure shows the water quality of Daqing River (taken on site by cell phone).

Fig. 1 Photo taken at the scene of Daqing River

Figure 2 The river area in the red box is the area captured by airborne hyperspectral imagery
1.2 Data acquisition equipment
In this experiment, the DJI six-rotor UAV M600 Pro (UAV net weight about 4 kg, maximum load about 10 kg) was used, and the GaiaSky-mini-2, a hyperspectral imaging spectrometer independently developed by Jiangsu Shuangli Hepu Technology Co. Ltd. The main parameters are shown in Table 1. The flight altitude was 300m, one flight, and a total of 27 hyperspectral images were acquired, with a spatial resolution of about 0.12m; the real-world view of the UAV remote sensing platform is shown in Figure 3.
Table 1 GaiaSky-mini 2 airborne imaging hyperspectrometer system parameters
|
No
|
Item
|
Parameter
|
|
1
|
Spectral scan range/nm
|
400~1000
|
|
2
|
Spectral resolution/nm
|
3.5 nm
|
|
3
|
Imaging lens/mm
|
18.5
|
|
4
|
Number of spectral channels
|
360
|
|
5
|
Full frame pixels
|
1936×1456
|
|
6
|
Sensor CCD Sony ICX
|
CCD Sony ICX 674
|
Figure 3 Airborne hyperspectral image capture site
1.3 Pre-processing and analysis of UAV hyperspectral data
The pre-processing of the UAV hyperspectral images is carried out in the SpecView software developed by Jiangsu Shuangli Hepu Technology Co. Ltd., including mirror transformation and black and white frame calibration (as shown in Equation 1).
 (1)
(1)
where Rref is the reflectance value of the black-and-white corrected image, DNraw is the DN value of the original image, DNwhite is the white frame data of the reference plate, DNdark is the systematic error DN value of the camera, and Rwhite is the reflectance coefficient of the reference plate.
Considering that the hyperspectral image data acquired by the hyperspectral imager may be affected by the atmosphere, water vapor and other factors after the UAV flies to a certain altitude. In order to eliminate the influence of these factors, we place a 2m*2m gray cloth calibrated by the National Institute of Metrology in the shooting area before the UAV takes off, and when the hyperspectral image is acquired, it is only necessary to cover to the gray cloth in one of the hyperspectral images. The method to eliminate the influence of atmospheric and water vapor factors is shown in Equation 2.
 (2)
(2)
Where Rfixed is the spectral reflectance of the image after eliminating atmospheric and water vapor factors, Rref is the reflectance of the image after black and white correction, Rstandard is the spectral reflectance of the gray cloth calibrated by the National Institute of Metrology, and Rgrayref is the spectral reflectance of the gray cloth in the image after black and white correction.
2 Results and Analysis
2.1 Stitching results
Figure 4 shows a preview of the three-band stitching effect of the UAV hyperspectral image of the Daqing River using the UAV hyperspectral stitching software (RGB represents the 640 nm/550 nm/460 nm nearest wavelengths, respectively).

Fig. 4 Stitched image taken by the Daqing River UAV hyperspectral (RGB pseudo-color composite image)
2.2 Inversion of river chlorophyll a
In the remote sensing of inland water bodies, chlorophyll a has a great influence on the spectral characteristics of water bodies, and its spectral data are an important indicator to reflect the degree of eutrophication of water bodies. When the concentration of chlorophyll a increases, the spectral reflectance of the blue light band decreases, and the spectral reflectance of the red and green light band increases, and when the concentration of chlorophyll a reach a certain value, the sensitive band of chlorophyll a move to the long wave direction. Therefore, in the remote sensing inversion of chlorophyll a, the commonly used method is to establish an empirical and semi-empirical model of the optimal band or a combination of various bands according to the sensitive band of chlorophyll a. There are three commonly used algorithms: (1) According to the reflection peak of chlorophyll a at 700nm, determine the chlorophyll an inversion model; (2) According to the ratio of the reflection peak of chlorophyll a at 700nm to the absorption peak at 675nm or 560nm (3) Using the semi-empirical aerial monitoring method, using the influence of chlorophyll a on the reflectance of water in the blue-green light band, the chlorophyll a concentration was established by the difference or ratio of the spectral reflectance in these two bands. Inversion model. When using TM images for chlorophyll a content analysis, it is generally believed that the ratio of TM2 (including 550 nm reflection peak) or TM3 (including 685 nm fluorescence peak) to TM1 (including 440 nm absorption peak) is the best method for estimating chlorophyll a concentration.
Taking the Daqing River as an example, the airborne hyperspectral imagery was used to invert the distribution of chlorophyll a concentration in the water quality of the Daqing River, as showed in Figure 5.
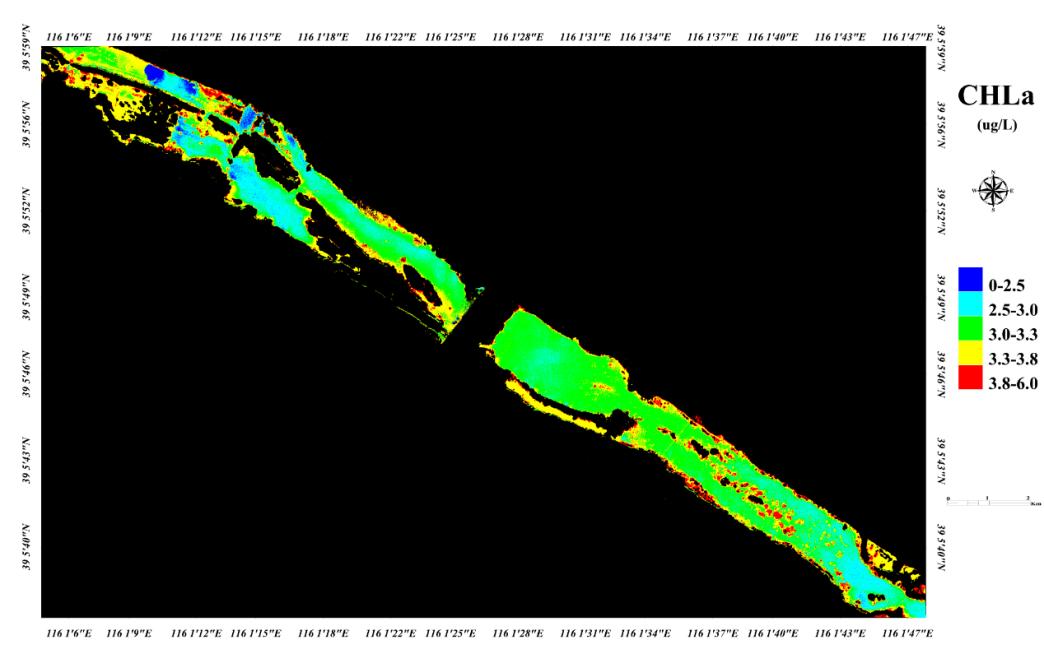
Fig. 5 Inversion map of hyperspectral chlorophyll a of Daqing river UAV
2.3 Inversion of river total nitrogen and total phosphorus
The content of total nitrogen and total phosphorus in the water is an important indicator to measure water quality. The conventional measurement method of nitrogen and phosphorus requires a long time of high temperature and high-pressure digestion, and the temperature, time and reagents of the digestion have a critical influence on the results of the determination. Remote sensing technology, through the measurement of nitrogen and phosphorus spectra in water, to explore the relationship between nitrogen and phosphorus in water and reflectance spectral characteristics, to establish inversion models of nitrogen and phosphorus concentrations, and to provide remote sensing of nitrogen and phosphorus for large inland water bodies such as lakes, reservoirs and rivers quantitative monitoring provides theoretical basis.
Taking the Daqing River as an example, airborne hyperspectral images are used to invert the distribution of total phosphorus concentration and total nitrogen concentration in the water quality of the Daqing River, as showed in Figure 6 and Figure 7.
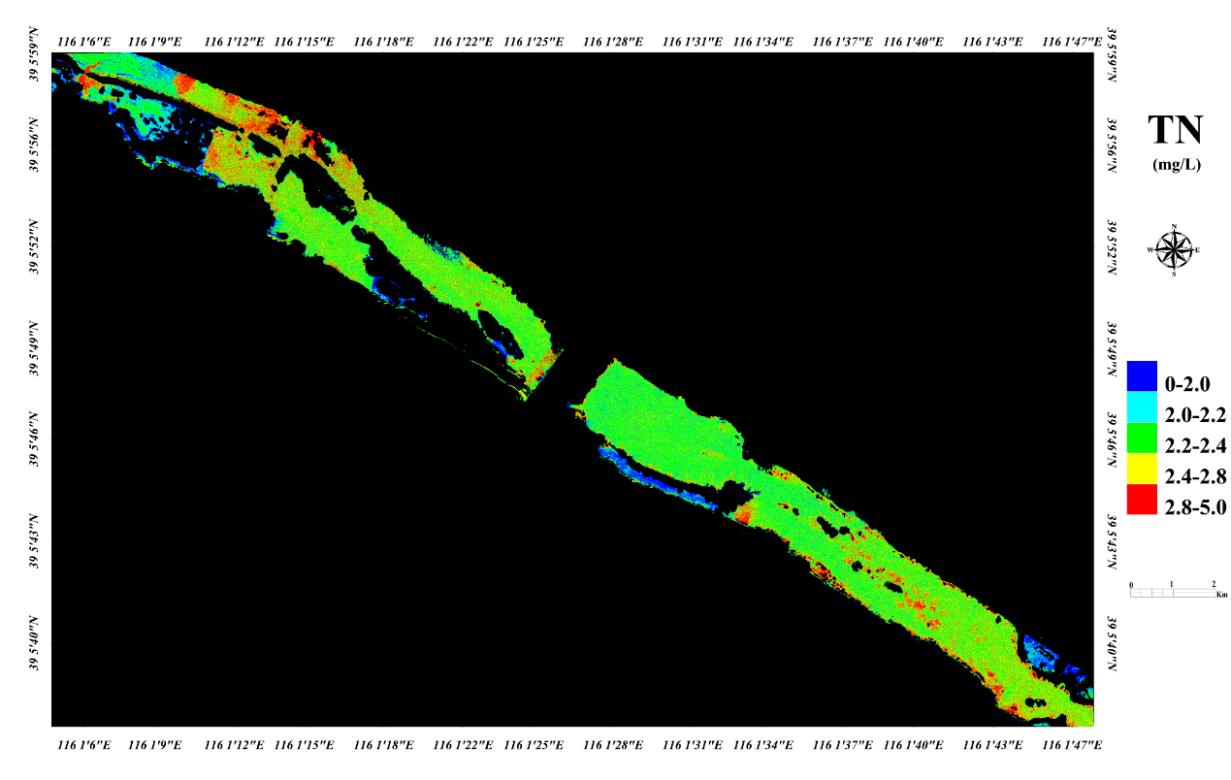
Fig. 6 Inversion map of UAV hyperspectral total phosphorus in Daqing River

Fig. 7 Inversion map of UAV hyperspectral total nitrogen in Daqing River
2.4 Inversion of river suspended matter and turbidity
Suspended solids concentration is part of the important water quality parameters in inland water bodies, which can affect the growth of aquatic organisms and the primary productivity of water bodies. The conventional monitoring method of suspended solids concentration is easily limited by external conditions, and cannot monitor the concentration of suspended solids in water in a large area and periodically. As a means of regional water environmental investigation and monitoring, remote sensing technology can overcome the shortcomings of conventional monitoring methods. It has become an essential tool for monitoring the temporal and spatial distribution of suspended solids concentration.
Taking the Daqing River as an example, the airborne hyperspectral image is used to invert the distribution of suspended matter concentration in the water quality of the Daqing River, as shown in Figure 8.
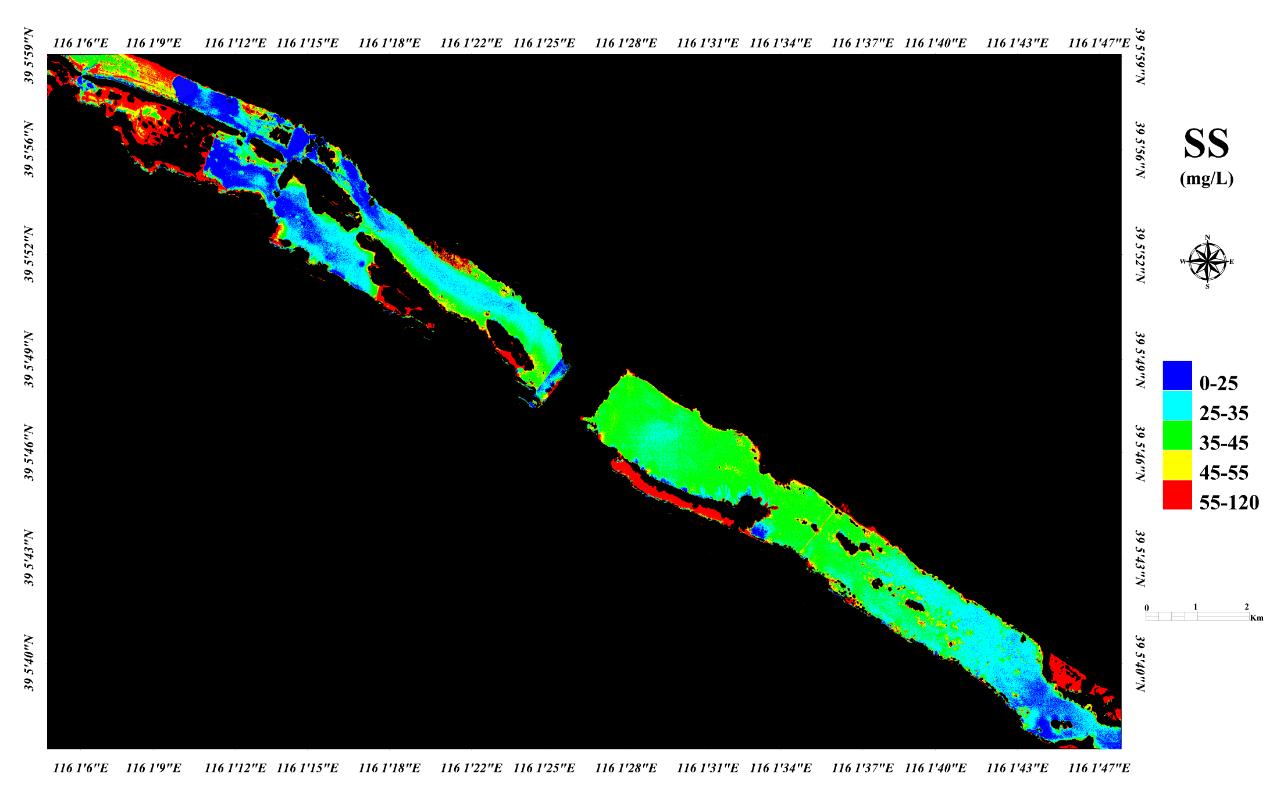
Fig. 8 Inversion map of UAV hyperspectral suspended matter concentration in Daqing River
2.5 Inversion of river chemical oxygen demand
Chemical Oxygen Demand (COD) is an important indicator of water quality monitoring to characterize the amount of reducing substances that need to be oxidized in water. The increasingly serious problem of environmental pollution, traditional measurement methods have been unable to meet the need for sewage detection due to high analysis costs, long time, and secondary pollution. The hyperspectral image data of the Daqing River is obtained by inverting the hyperspectral image data of the UAV according to the water quality chemical oxygen demand monitoring model established by Jiangsu Shuangli Hepu Spectrum, as shown in Figure 9.
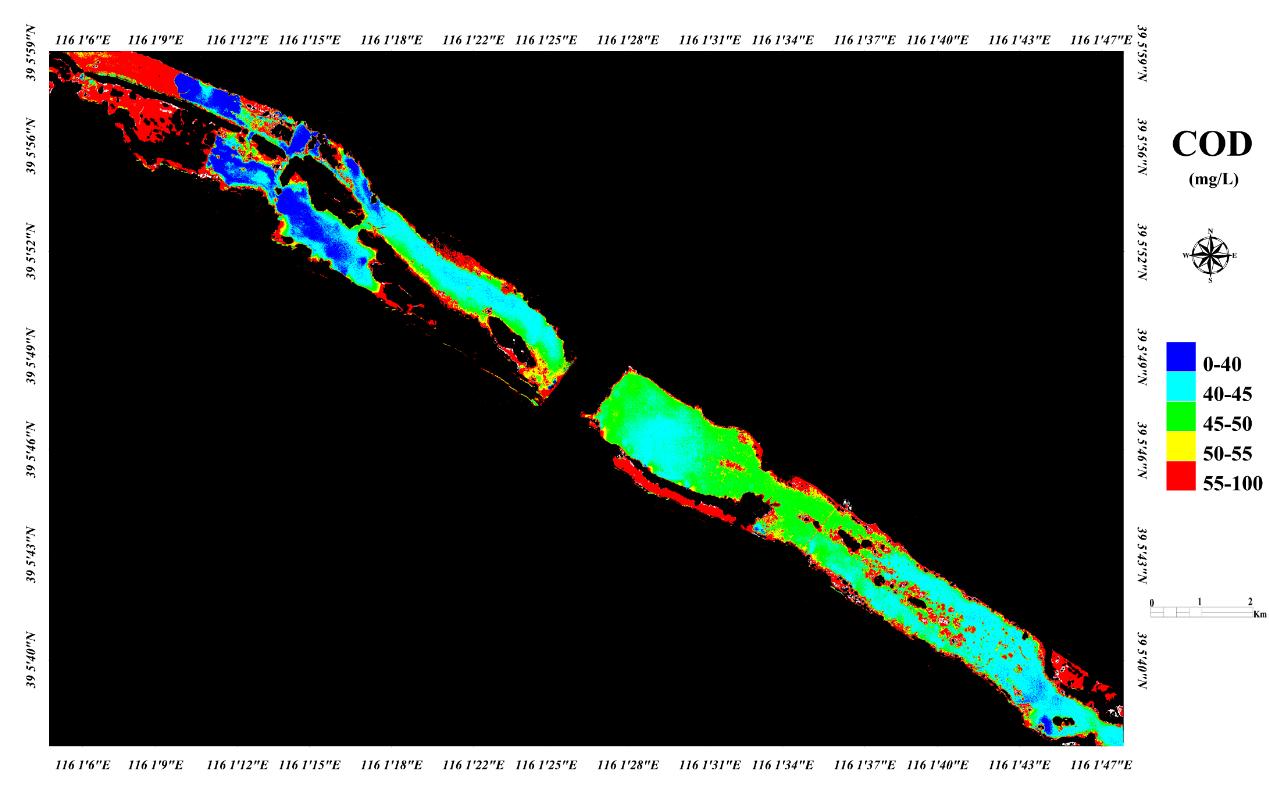
Fig. 9 Inversion map of UAV hyperspectral chemical oxygen demand in Daqing River
3 Results and Discussion
This paper takes the Daqing River as the research object, uses a UAV equipped with a hyperspectral imager to obtain the spectral image information of the river, and then uses the stitching software to stitch the acquired images to obtain a complete hyperspectral image data of a river. In this paper, based on the water quality monitoring model constructed by Jiangsu Shuangli Hepu Spectrum, an inversion study of eutrophication (chlorophyll a, total nitrogen, total phosphorus) and water pollution (suspended solids concentration, COD) was performed in Daqing River. According to the on-site investigation and hyperspectral image inversion effect, the use of UAV hyperspectral can reflect the eutrophication and pollution degree of the river to a certain extent, and according to the eutrophication and pollution distribution of the river on the image, Determine the source of pollution in the river and the cause of eutrophication in the water body. The research results can provide technical assistance for river governance by water conservancy and hydropower departments and environmental protection departments.
Therefore, use of UAV hyperspectral technology can monitor the eutrophication and water pollution of rivers, lakes and oceans very well, and has broad application prospects. However, although researchers have proposed a number of monitoring and estimation models for eutrophication and water pollution in rivers, lakes, and oceans, each model has specific research methods and applicable conditions. For all rivers, lakes, and oceans , so it is difficult to find a general model to monitor it. At the same time, UAV hyperspectral remote sensing data has some defects, such as the interference of landscape heterogeneity, atmospheric noise, sun position, etc., which will affect the practical application ability of hyperspectral remote sensing technology. Therefore, how to use UAV hyperspectral technology to change the research on eutrophication and water pollution of rivers, lakes and oceans from qualitative research to quantitative research is the current difficulty and hotspot.

 13910278534
 010-56370168