Application of hyperspectral techniques in ore exploration
I Purpose of the test
The hyperspectral imager is used to obtain hyperspectral data on mineral rocks and to analysis them spectroscopically to determine their composition.
Ⅱ Test principle and method
Hyperspectral imaging technology is a technology based on very narrow band image data developed in the last two decades. Its most prominent application is in the field of remote sensing detection and has a greater prospect of application in more and more civil fields. It concentrates innovative technologies in the fields of optics, optoelectronics, electronics, information processing and computer science, and is an emerging technology that organically combines traditional two-dimensional imaging technology with spectral technology.
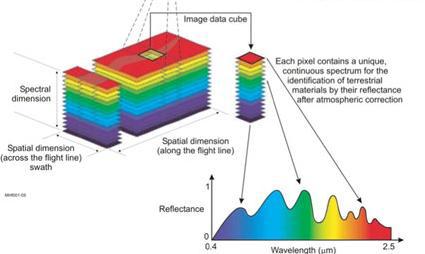
Hyperspectral imaging technology is defined as continuous imaging of a target object in the spectral range from ultraviolet to near infrared (200-2500nm) using an imaging spectrometer in tens or hundreds of spectral bands within the spectral coverage. The spatial characteristics of the object are imaged while the spectral information of the object under test is likewise obtained.
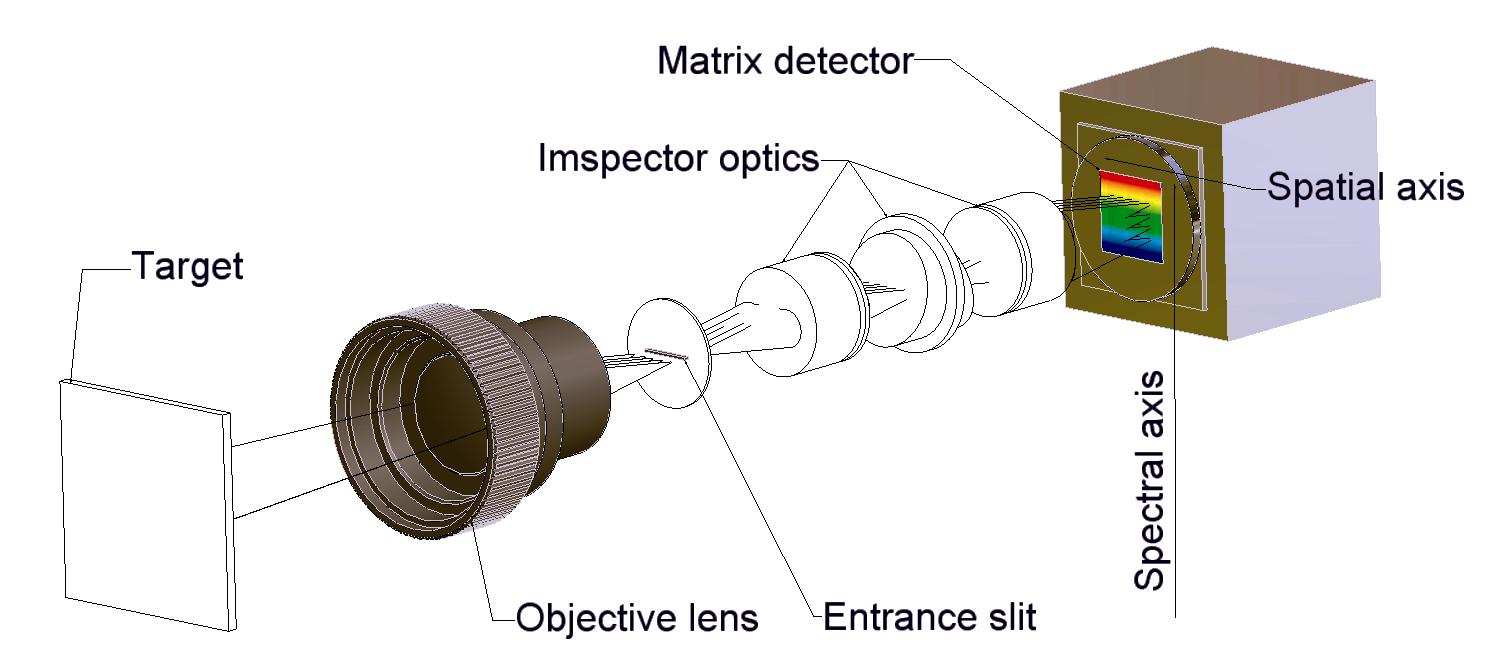
Figure 1 Principle diagram of hyperspectral imaging
The spectral resolution of the spectrometer is given in the width of the slit and the linear dispersion produced by the optical spectrometer. The minimum spectral resolution is given in the imaging performance of the optical system (point spread size).
The imaging process is as follows: after each image is formed on a line (X direction), in the process of the conveyor belt of the detection system moving forward, the arrayed detectors sweep out a strip-shaped track to complete the longitudinal scan (Y direction). Three-dimensional hyperspectral image data of the sample can be obtained by integrating the horizontal and vertical scanning information.
The Gaia-Sorter hyperspectral sorter was used as the test equipment and an imager with a spectral range of 1000nm-2500nm was used to complete the data acquisition.
Figure 2 Hyperspectral image cube
Ⅲ Experimental sample
1.Identification of unknown rocks
The samples were subjected to an imager in the 400-1000nm band. Spectral characteristic spectral information of mineral rocks in the 400nm-1000nm band was very limited. The spectral characteristics of this band were utilized to classify and identify them, and the results were not ideal. Figure 3 shows one of the samples to be checked, and three regions of interest are selected as the research objects. Figure 4 displays the characteristic spectral curve corresponding to the region of interest in Figure 3. Its characteristic spectral curve is very limited.
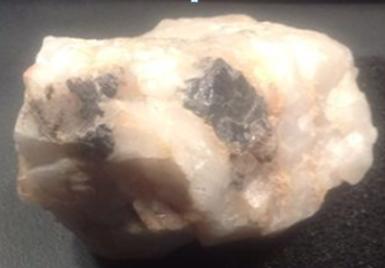
Figure 3 RGB image of the sample
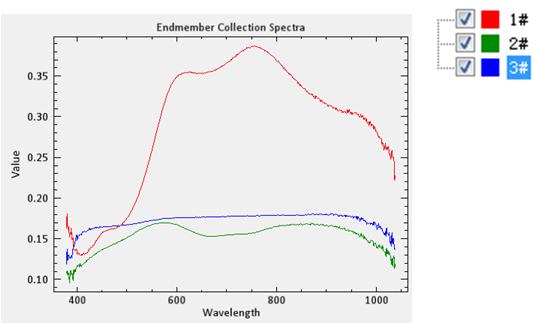
Figure 4 Spectral characteristic curve of the sample in the 400-1000nm band

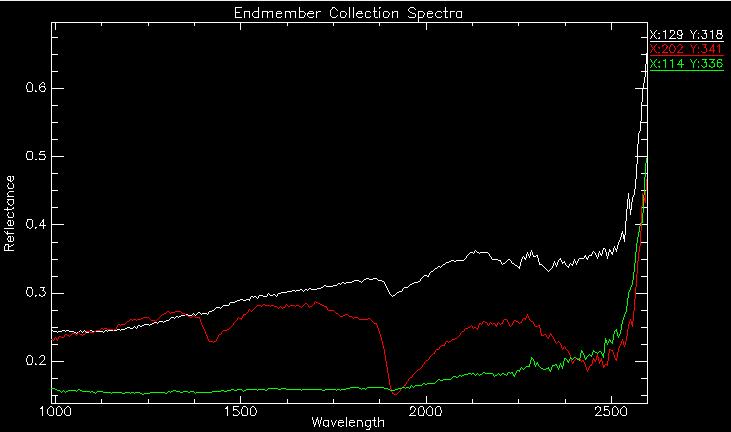
Figure 5 Spectral characteristic curve of the sample in the 1000-2500nm band
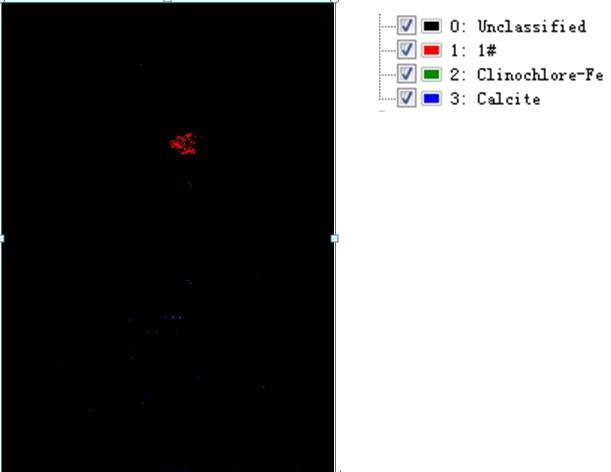
Figure 6 Results of mineral rock identification
Figure 7 Different colors indicate different mineral compositions
Clinochlore, composition (Mg, Fe) 4.75Al1.25 [Al1.25Si2.75O10] (OH) 8. Monoclinic. The crystals are pseudo-hexagonal, and the aggregates are scaly. Grass green to pale olive green.
Calcite, is a calcium carbonate mineral that is most frequently used in natural calcium carbonates. Therefore, calcite is a widely used mineral. The crystal shapes of calcite are various, and their aggregates can be clusters of crystals, as well as granular, massive, fibrous, stalactite, earthy and so on. Knocking calcite can get a lot of upright fragments, hence the name calcite.
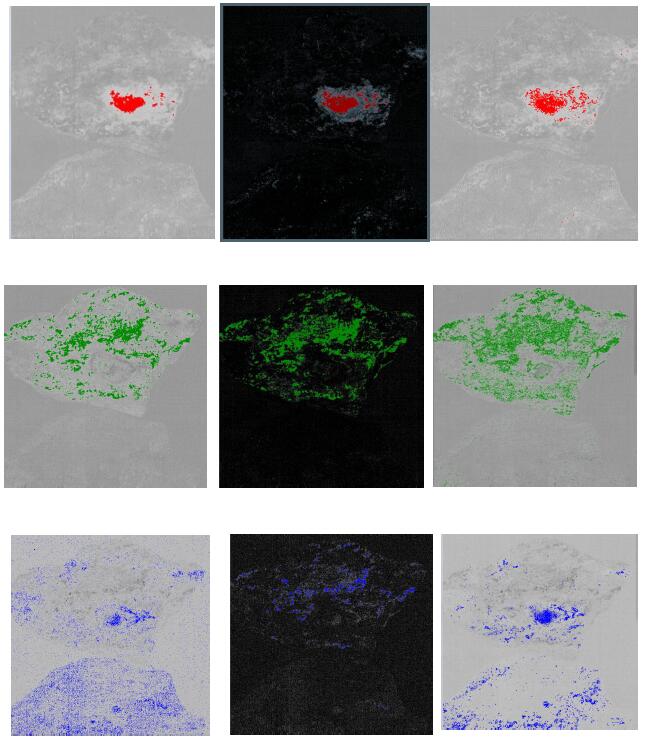
Figure. 8 Differences of rocks with different compositions
2. Analysis of graphite sample data
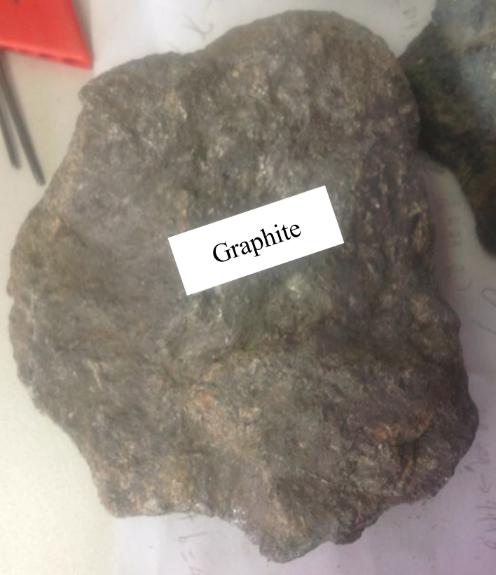
Figure 1 Graphite mineral rock map (photographed by mobile phone)
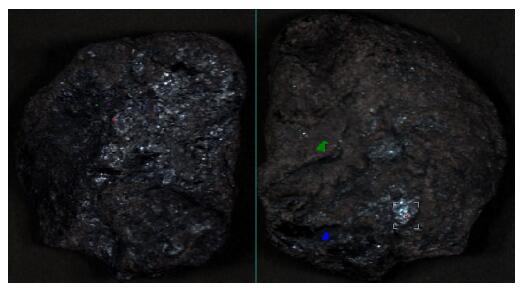
Figure 2 RGB image
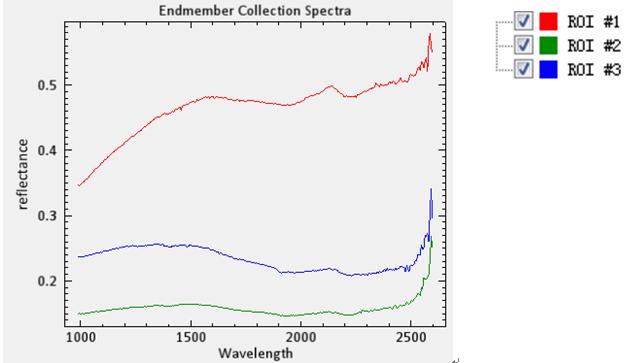
Figure 3 Characteristic spectral curve of the region of interest
The spectral feature fitting (SFF) method, the degree of matching to the Popper library is measured by the RMS fitting error, and the minimum and maximum values of the input are expressed in terms of the RMS fitting error. If the matching result is less than or equal to the minimum value, the match is good and the score is 1. If the matching result is greater than or equal to the maximum value, the score is 0.
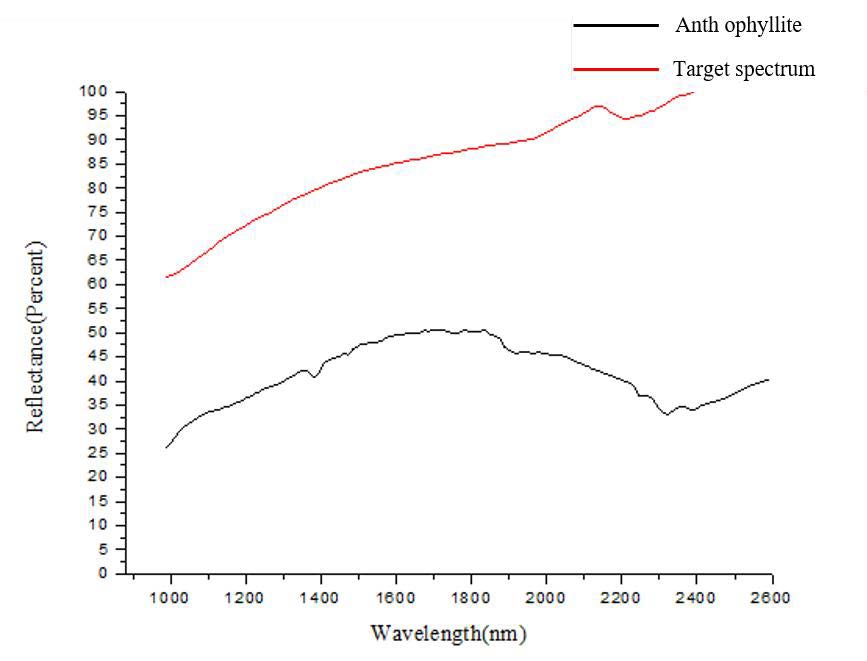
Figure 4 Spectral match of target spectrum to Anthophyllite (anthophyllite)
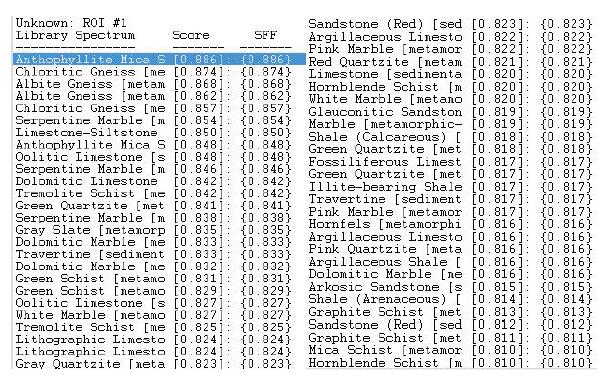
Figure 5 Matching values obtained under the Spectral Feature Fitting (SFF) method
3. Identification of molybdenite
The chemical composition is MoS2 sulfide mineral, molybdenite is lead-gray, strong metallic luster. The crystals are hexagonal plates, hexagonal and trigonal. The chemical composition is MoS2, Mo molybdenum 59.94%, S sulfur 40.06%; the reflection color is grayish white. Reflectance: Ro is 36.0 (green light), 31.5 (orange light), 30.5 (red light); Re is 15.5, 18, and 15, respectively. Strong double reflection, Ro-white with snow blue, re-yellow. Strong heterogeneity.
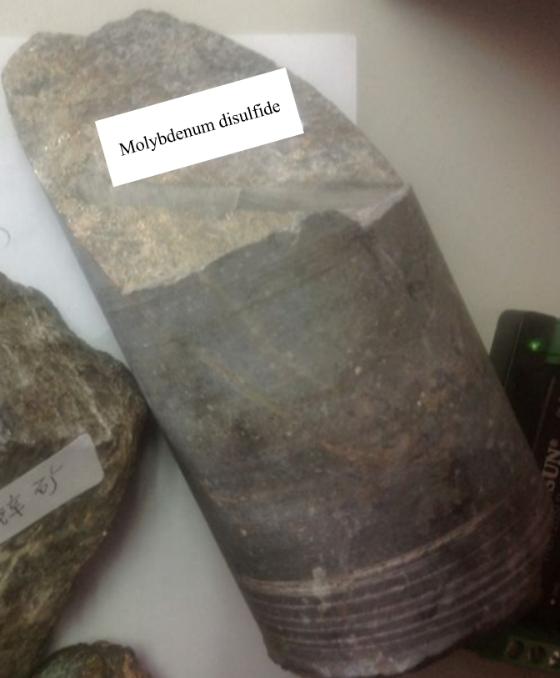
Figure 1 Molybdenite (mobile phone photo)

Figure 2 RGB image (3 regions of interest)
Figure 3 Characteristic spectral profiles of the 3 regions of interest
Using the Spectral Angle Mapping (SAM) method, the match to the Popper library is measured by the radian, with the keyed minimum and maximum values being reflected in radians.
With the Spectral Feature Fitting (SFF) method, the degree of match to the Popper library is measured by the RMS fitting error, with both the minimum and maximum values entered expressed in terms of RMS fitting error. If the match result is lower than or equal to the minimum value, the match is good and a score of 1 is assigned; if the match result is greater than or equal to the maximum value, a score of 0 is assigned.
For the binary coding method, both the minimum and maximum values of the input are given in the percentage of bands correctly matched (0-1).
The same weighting factor is established for all three methods, with a weighting factor of 1. all three methods are used simultaneously for the calculation of the judgement. The maximum and minimum values are 1 and 0 respectively, participating in a scoring range normalised to between 0 and 1.
After processing, the unknown spectrum matches the standard spectral library:
|
|
Unknown-spectrum
|
Standard Spectra
|
Score
|
SAM
|
SFF
|
BE
|
Identification results
|
|
1
|
202 Spectral Curve
|
Basalt
|
2.453
|
0.85
|
0.853
|
0.75
|
Basalt
|
|
2
|
202 Spectral Curve
|
Augite-hyperstheme
|
2.345
|
0.847
|
0.855
|
0.642
|
Pyroxene
|
|
3
|
129 Spectral Curve
|
Ijolite
|
2.571
|
0.863
|
0.76
|
0.948
|
Nephelinit
|
4.unknown mineral rock analysis:
Figure 1 Sample image taken by mobile phone
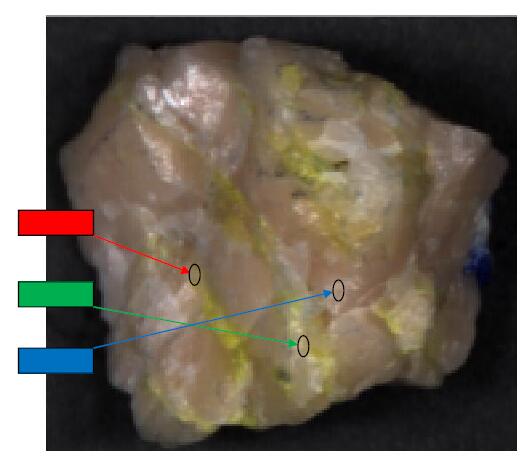
Figure 2 RGB composite map & area of interest (red, green and blue)
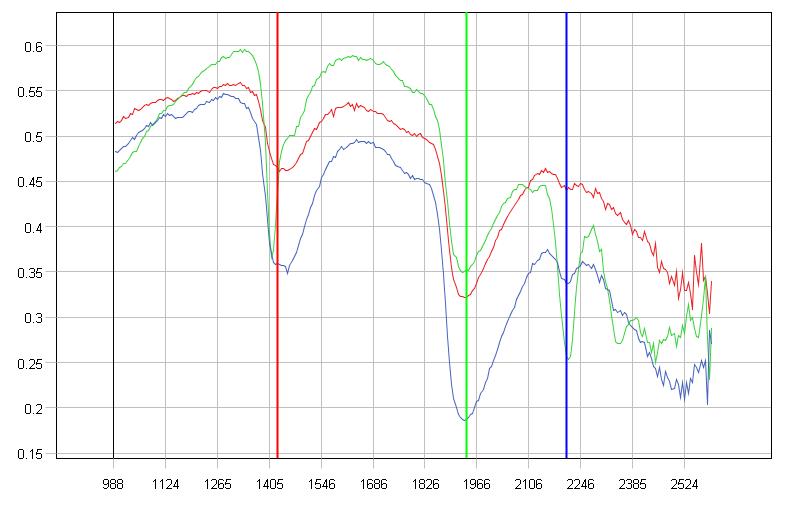
Figure 3 Location of characteristic wavelengths in the region of interest
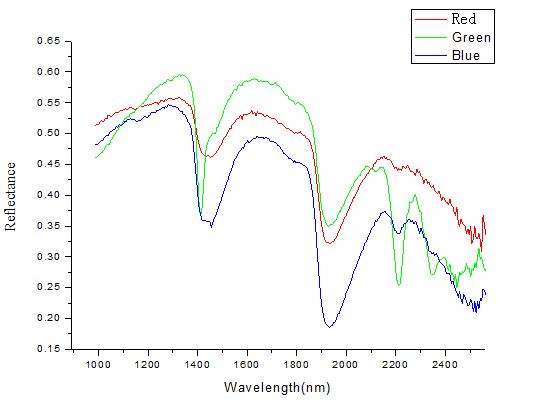
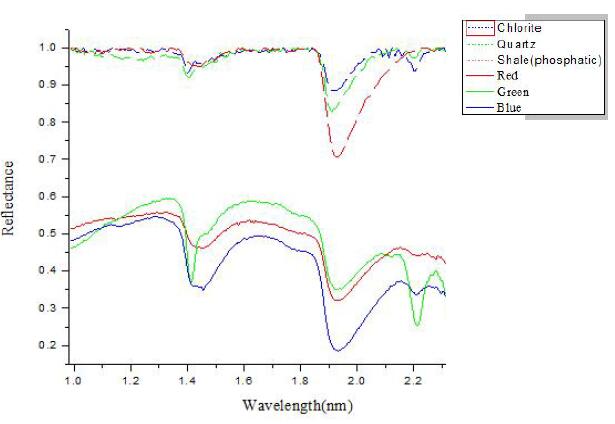
Figure 4 Characteristic spectral lines
Figure 5 Spectra of the region of interest matched to the standard spectrum
Using the Spectral Angle Mapping (SAM) method, the fit to the Pop library is measured in radians, and the keyed minimum and maximum values are reflected in radians.
The spectral feature fitting (SFF) method, the degree of matching with the pop library is measured by the RMS fitting error. The minimum and maximum input values is both represented by the RMS fitting error. If the matching result is less than or equal to the minimum value, it means if the matching degree is good, the score is 1; if the matching result is greater than or equal to the maximum value, the score is 0.
Binary encoding, the minimum and maximum values of the input are given in a percentage of correctly matched bands (0-1).
The three methods set the same weight coefficient, and the weight coefficient is all 1, that is, the three methods are used for the calculation and evaluation at the same time. The maximum and minimum values are 1 and 0, respectively, and participate in the normalization to a scoring range between 0-1.
After processing, the unknown spectrum matches the standard spectral library:
|
No.
|
Unknown spectrum
|
Standard Spectra
|
Score
|
SAM
|
SFF
|
BE
|
Identification results
|
|
1
|
Red Spectral Curve
|
Shale(phosphatic)
|
2.449
|
1.00
|
0.858
|
0.590
|
Phosphorous Shale
|
|
2
|
Green Spectral Curve
|
Quartz
|
2.364
|
1.00
|
0.857
|
0.507
|
quartz
|
|
3
|
Blue Spectral Curve
|
Chlorite
|
2.449
|
1.00
|
0.858
|
0.590
|
Chlorite
|
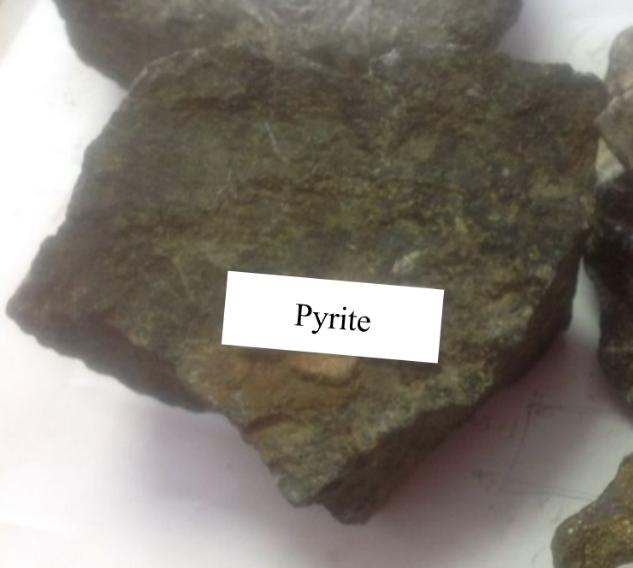
5.Pyrite mineral identification
Figure 1 Pyrite mineral rock map (mobile phone photo)

Figure 2 Characteristic spectral curve of pyrite
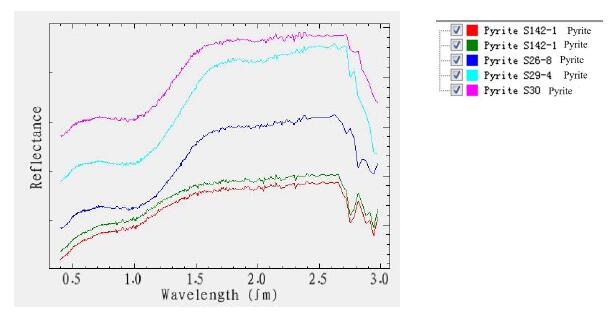 Figure 3 Standard pyrite characteristic spectral curve
6.Analysis results
Using a hyperspectral imager to obtain the hyperspectral data of the sample, and combining the spectral analysis method to perform spectral analysis and matching of the sample mineral rock. The composition of the sample can be identified and judged. Because the mineral rock sample itself is not pure, the composition of different samples the composition is not the same, and the characteristic information of minerals in different bands is also different. In the above data analysis, the composition of the rock can be preliminaries judged, including the results obtained by the analysis.

 13910278534
 010-56370168