Visualization of lamb adulteration based on hyperspectral imaging
Meat mainly includes livestock, poultry and aquatic products, and is the source of protein, fatty acids, trace elements and other important energy substances required by the human body. As living standards continue to improve, people pay more attention to the quality and nutritional balance of food, but some unscrupulous merchants mix low quality meat with high quality meat, especially the 2013 "horsemeat fiasco" in Europe, which has aroused great concern about meat adulteration. Meat adulteration detection methods include sensory evaluation, fluorescence PCR, electrophoresis and enzyme immunoassay, but most of them require sample pre-treatment, which is tedious and time-consuming, making it difficult to achieve rapid real-time detection in the field with large sample volumes.
Hyperspectral imaging technology is a comprehensive NDT technique that can simultaneously characterize one-dimensional spectral information and two-dimensional spatial information, and has been extensively used in the pharmaceutical, agricultural and ecological protection industries. Most of the existing studies in the literature have used a single band of hyperspectral imaging technology to identify meat adulteration, but few have used both bands for comparative analysis. In this study, the hyperspectral information in the visible-NIR (400-1000 nm) and short-wave NIR (900-1700 nm) bands was collected, and a quantitative model was established by selecting a suitable pre-processing method and the optimal model was selected for image inversion. The method is intended to provide data and technical support for the quantitative detection of lamb adulteration in China.
1. Test materials and methods
1.1 Test samples
Fresh lamb and duck meat were purchased from fresh supermarkets and stored at low temperature for one hour before being returned to the laboratory.
1.2 Test equipment
GaiaField-Pro-V10E (spectral range 400-1000nm, spectral resolution 2.8nm, spectral sampling interval 0.7nm, spectral channel number 125) and GaiaField-Pro-N17E (spectral range 900-1700nm, spectral resolution 5nm, spectral sampling interval 3.5nm). Spectral sampling interval of 3.5nm, number of spectral channels 512) by Jiangsu Shuangli Hepu Technology Co.As showed in Figure 1.
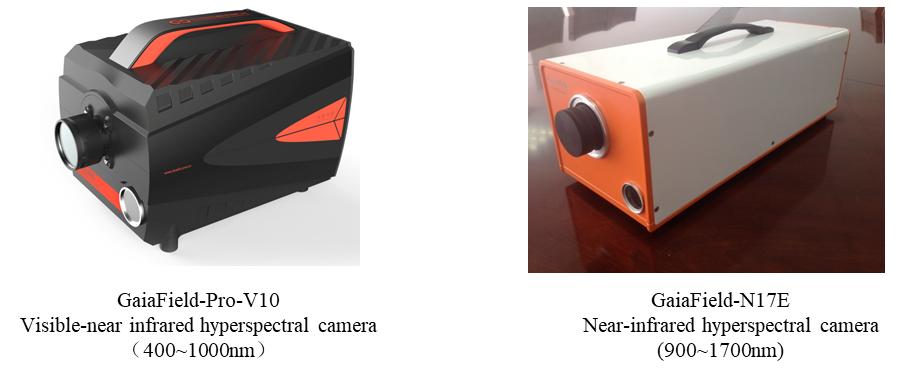
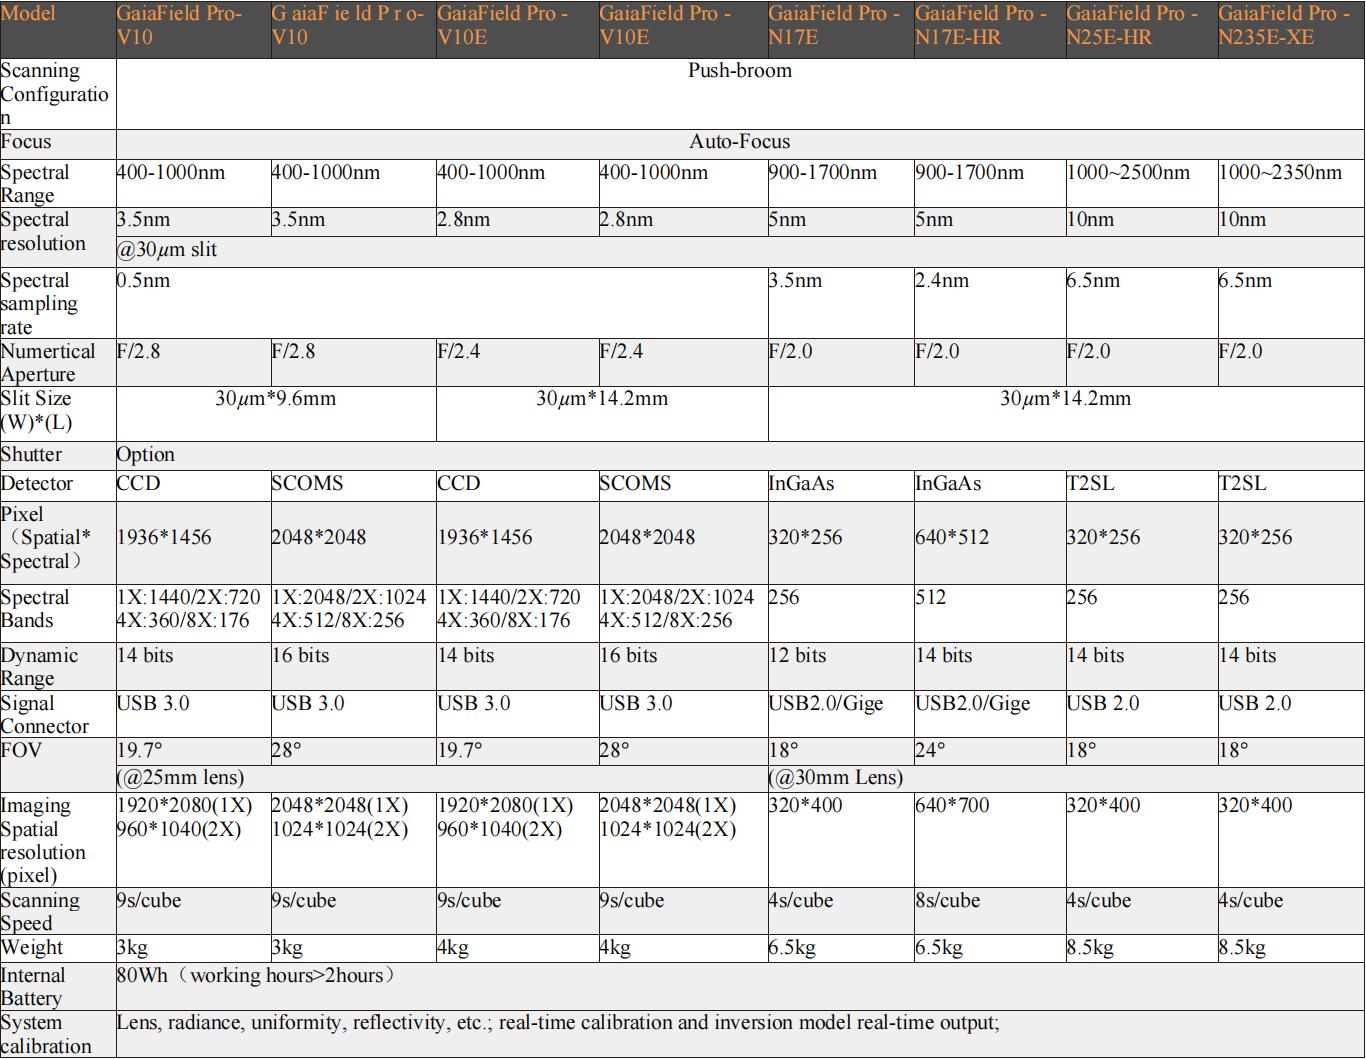
Figure1 Physical map and parameters
1.3.1 Preparation of experimental samples1.3 Experimental methods
Visible fat was removed from lamb and duck meat to reduce interference with the experimental results. After cutting the lamb and duck meat into pieces, the corresponding lamb and duck meat were weighed into a blender and blended for 4 min according to certain adulteration ratios (10%-90%, adulteration interval of 10%, total 50 g per sample), so that the samples were well mixed and then put into a Petri dish and spread flat. Five parallel samples were prepared for each adulterated sample, and five pure lamb samples and five pure duck samples were prepared at the same time, making a total of 55 samples.
1.3.2 Acquisition and calibration of hyperspectral images
Before the hyperspectral image acquisition, the stability of the light source should be ensured and the influence of the spectrometer itself should be eliminated, so the hyperspectral instrument was turned on and preheated for 30 min before the experiment, and then the images were acquired.
After acquiring spectral information for 55 samples, the Teflon white plate (99.99% reflectance) was scanned under the same acquisition conditions to obtain an all-white calibration plate image, and the camera lens cap was covered to obtain an all-black background image, using black and white correction to reduce the effect of dark currents in the instrument itself and the reflection of the light source by the sample itself. In this case, the black and white correction equation is
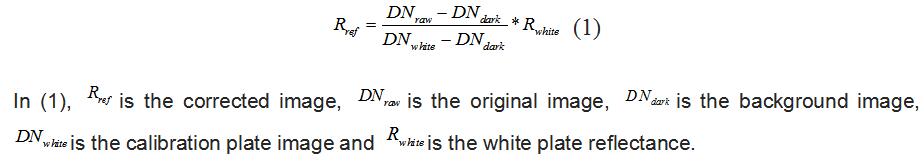
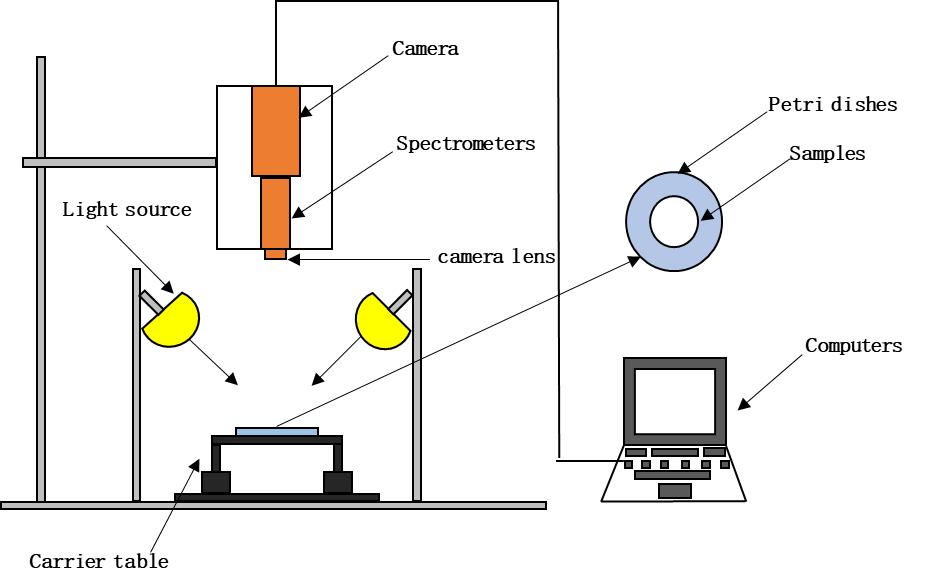 Figure 2 Schematic diagram of hyperspectral system structure
2. Results and discussion
2.1 Characteristics of the spectral curves of the samples
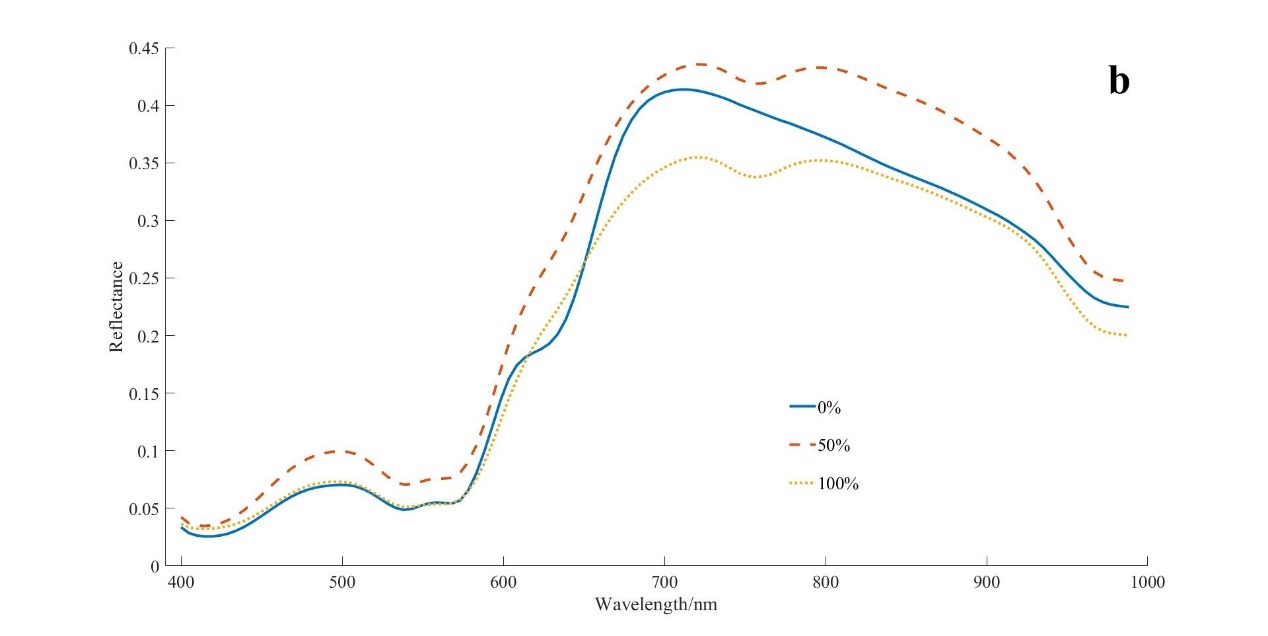
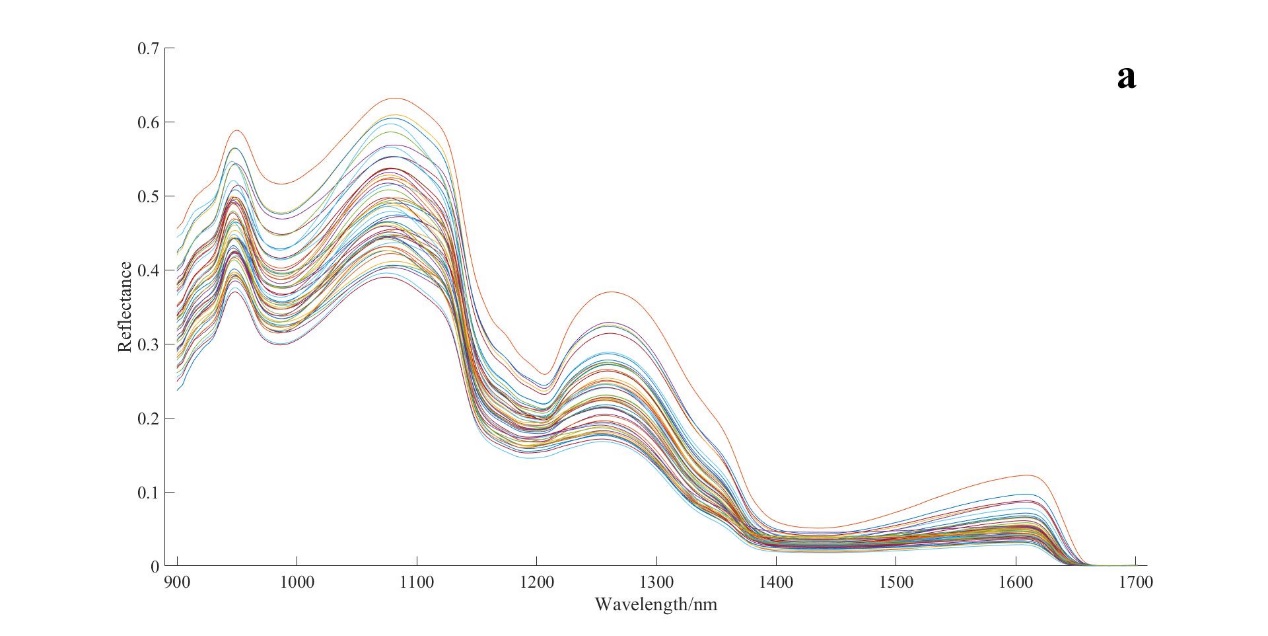
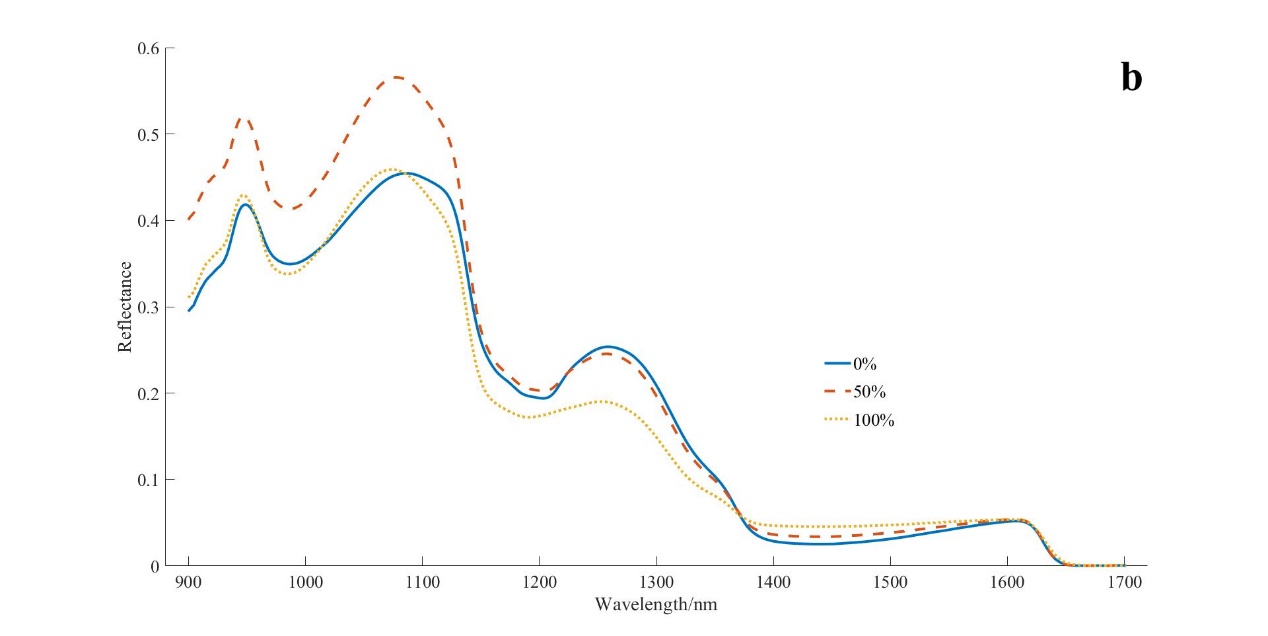
Figure 3 shows the original spectral images of all samples at 400-1000nm and Figure 4 shows the original spectral images of all samples at 900-1700nm. It can be seen in Fig. 3(a) and Fig. 4(a) that the trends of the spectral curves of the unadulterated and adulterated samples are roughly similar, but from the three spectral curves with different adulteration ratios (0%, 50%, 100%) in Fig. 3(b) and Fig. 4(b), it can be seen that in the 500nm-800nm band, 1000-1400nm band, the adulterated samples are relatively different from the unadulterated samples in terms of There is no clear pattern of increase or decrease in the reflectance curves with the increase of the adulteration percentage in the whole spectral range (400-1000nm and 900-1700nm).
Figure 3 Original spectra of samples (400-1000nm)
(a) All samples (b) Samples with different adulteration ratios
Figure 4 Original spectra of samples (900-1700nm)
(a) All samples (b) Samples with different adulteration ratios
2.2 Feature wavelength selection and modelling
The best modelling results were found for the 900-1700nm band by feature wavelength selection, and the wavelengths selected by different wavelength selection methods are shown in Figure 5. As can be seen from Table 1, the best modelling results were also obtained after the SPA method of wavelength selection, with a total of 13 wavelengths selected, namely: 899.83nm, 926.51nm, 942.2nm, 965.74nm, 1003.4nm, 1111.68nm, 1136.79nm, 1207.41nm, 1372.18 nm, 1574.62 nm, 1623.27 nm, 1640.53 nm, and 1690.75 nm. The modelling result is shown in Figure 6.
Table 1 Effect of PLSR modeling for 900-1700 nm
|
Model
|
Variables
|
PLS
factors
|
Calibration
|
Prediction
|
|
R2cv
|
SECV
|
R2p
|
RMSEP
|
RPD
|
|
CARS
|
14
|
13
|
0.9167
|
0.0996
|
0.9575
|
0.0184
|
4.8507
|
|
iRF
|
70
|
7
|
0.9062
|
0.0967
|
0.9434
|
0.0197
|
4.2033
|
|
SiPLS
|
205
|
6
|
0.9092
|
0.0951
|
0.9554
|
0.0600
|
4.7351
|
|
SPA
|
13
|
7
|
0.9191
|
0.0997
|
0.9684
|
0.0582
|
5.6254
|
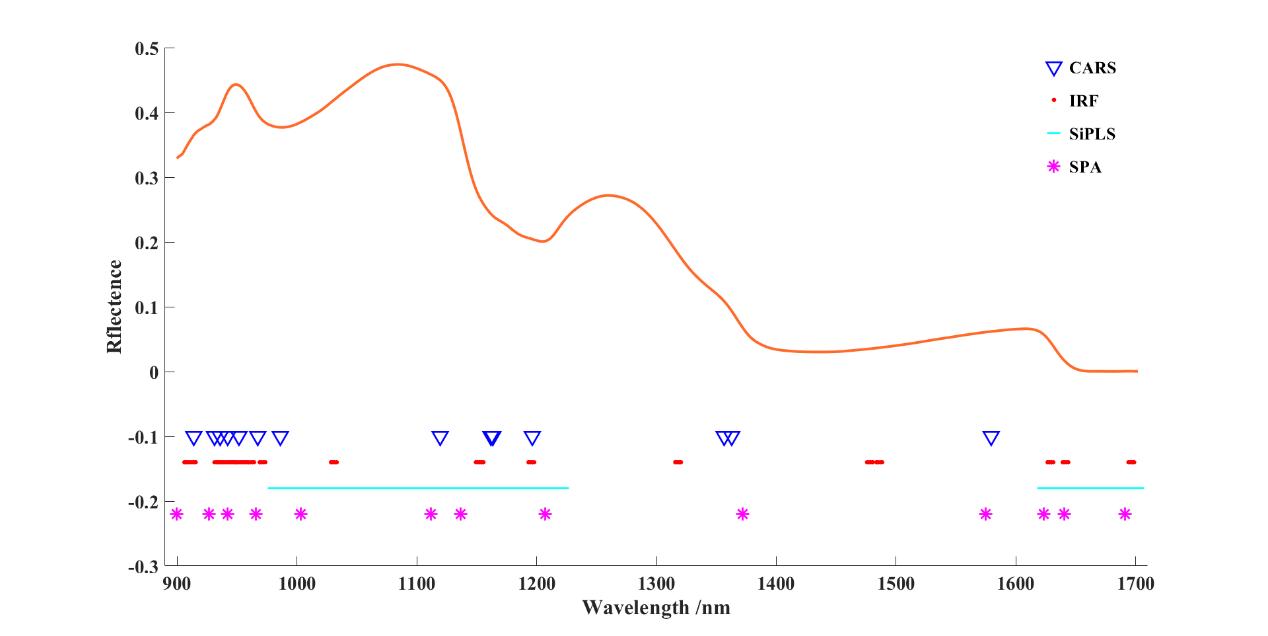
Fig. 5 Selection of wavelengths in the 900-1700 nm band
Fig.6 900-1700nm band with SPA modeling effect
2.3 Visualization of adulteration
The adulteration trend is evident in Figure 7, where the color deepens (from blue to red) as the proportion of adulteration increases. Hyperspectral imaging provides a practical and reliable way to visualize the distribution of adulterated samples, which are not possible with other methods. However, for each individually prepared adulterated sample, the distribution of adulterated samples was found to be inhomogeneous in Figure 7, despite the fact that the samples were mixed as homogeneously as possible during the pre-sample preparation process.
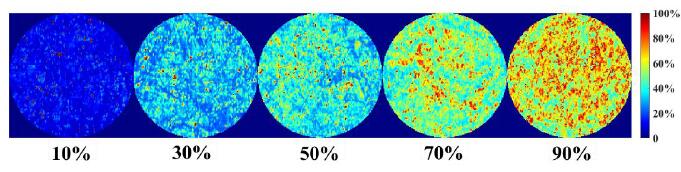
Figure 7 visualization image of lamb adulteration and duck adulteration
3. Conclusion
The 900-1700nm band contains more information about the composition of meat, which is more reflective of the characteristics of meat and may be more suitable for the identification of meat adulteration. In order to expand the comprehensiveness and applicability of the model, the test should be extended to the long-wave NIR band (1700-2500nm). Further validation is needed.

 13910278534
 010-56370168